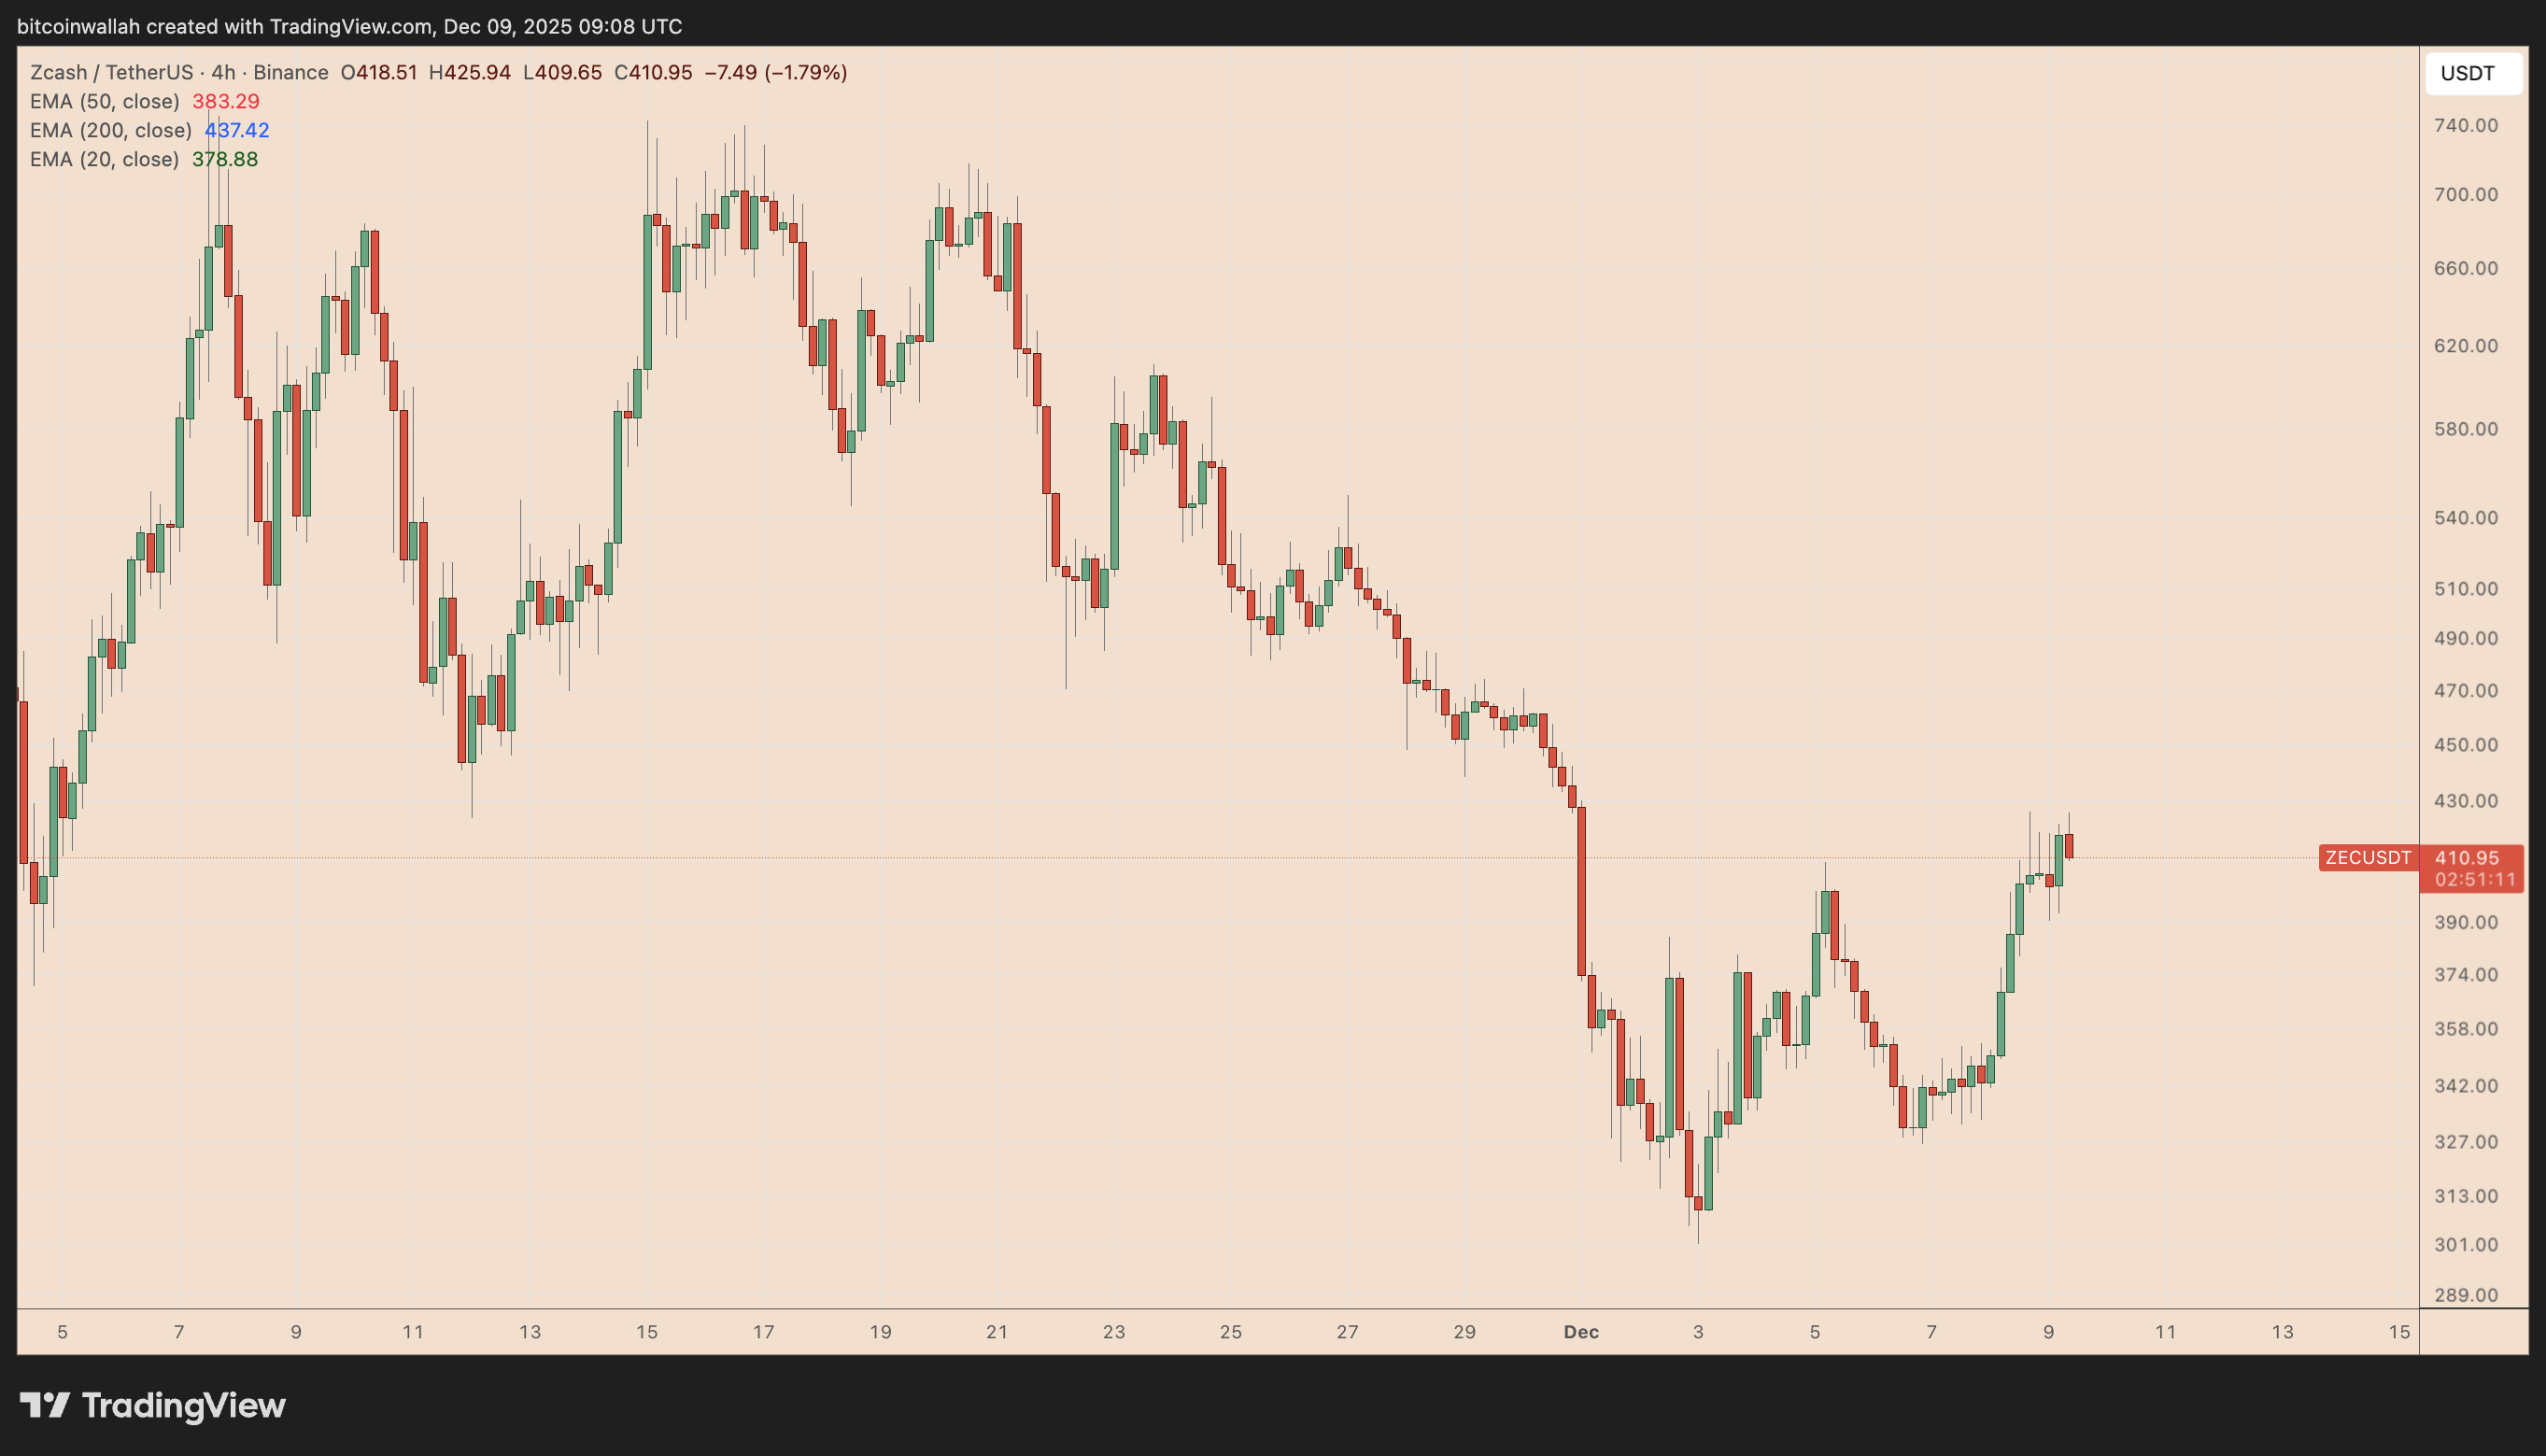
Zcash (ZEC) extended its recovery on Tuesday, rising 10.29% in the past 24 hours to over $425, or 41.50% up from the lows of around $300 just a week ago.
Key takeaways:
ZEC eyes $500 as double-bottom signals and whale accumulation support the recovery.
Bear-flag risks persist, with overbought RSI hinting at a possible pullback toward $260–$280.
The sharp rebound prompted some analysts to anticipate a further rally to or above $500 in the coming days.
Can Zcash retest the psychological resistance?
From double bottom to $500 ZEC next?
Trader Goomba identified Zcash’s recent swing lows as a potential double-bottom structure.
The pattern appeared to develop in the $300–$310 region, where ZEC recorded two similar troughs within a short time frame. The subsequent move above the interim resistance near $380 marked what the trader described as a neckline breakout.
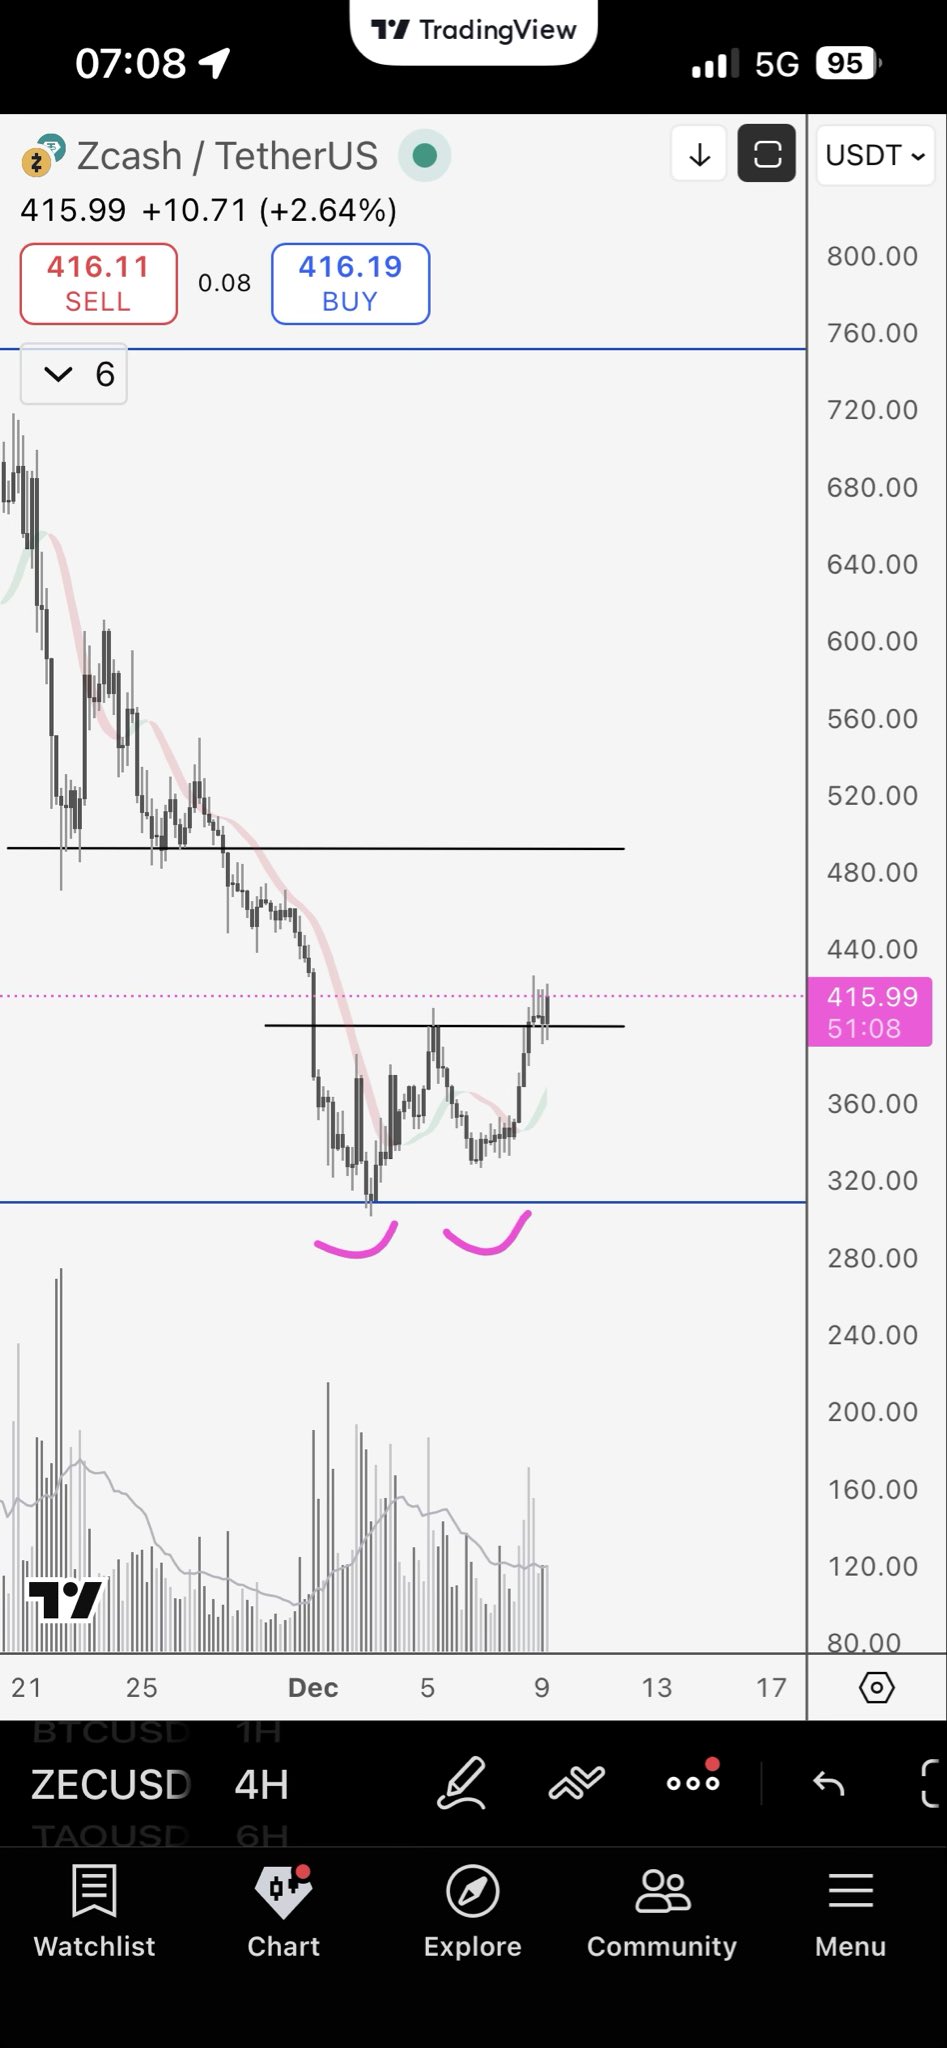
Such formations carry a measured objective that places the next notable target in the $480–$500 range, coinciding with a previous supply zone.
Goomba noted that the structure remained valid as long as ZEC held above the reclaimed neckline level.
Zcash whales are absorbing selling pressure
ZEC’s retail holders ($0–$1,000) and mid-sized traders ($1,000–$100,000) cut more than $30 million in net exposure during the latest rebound, according to data highlighted by trader Ardi.
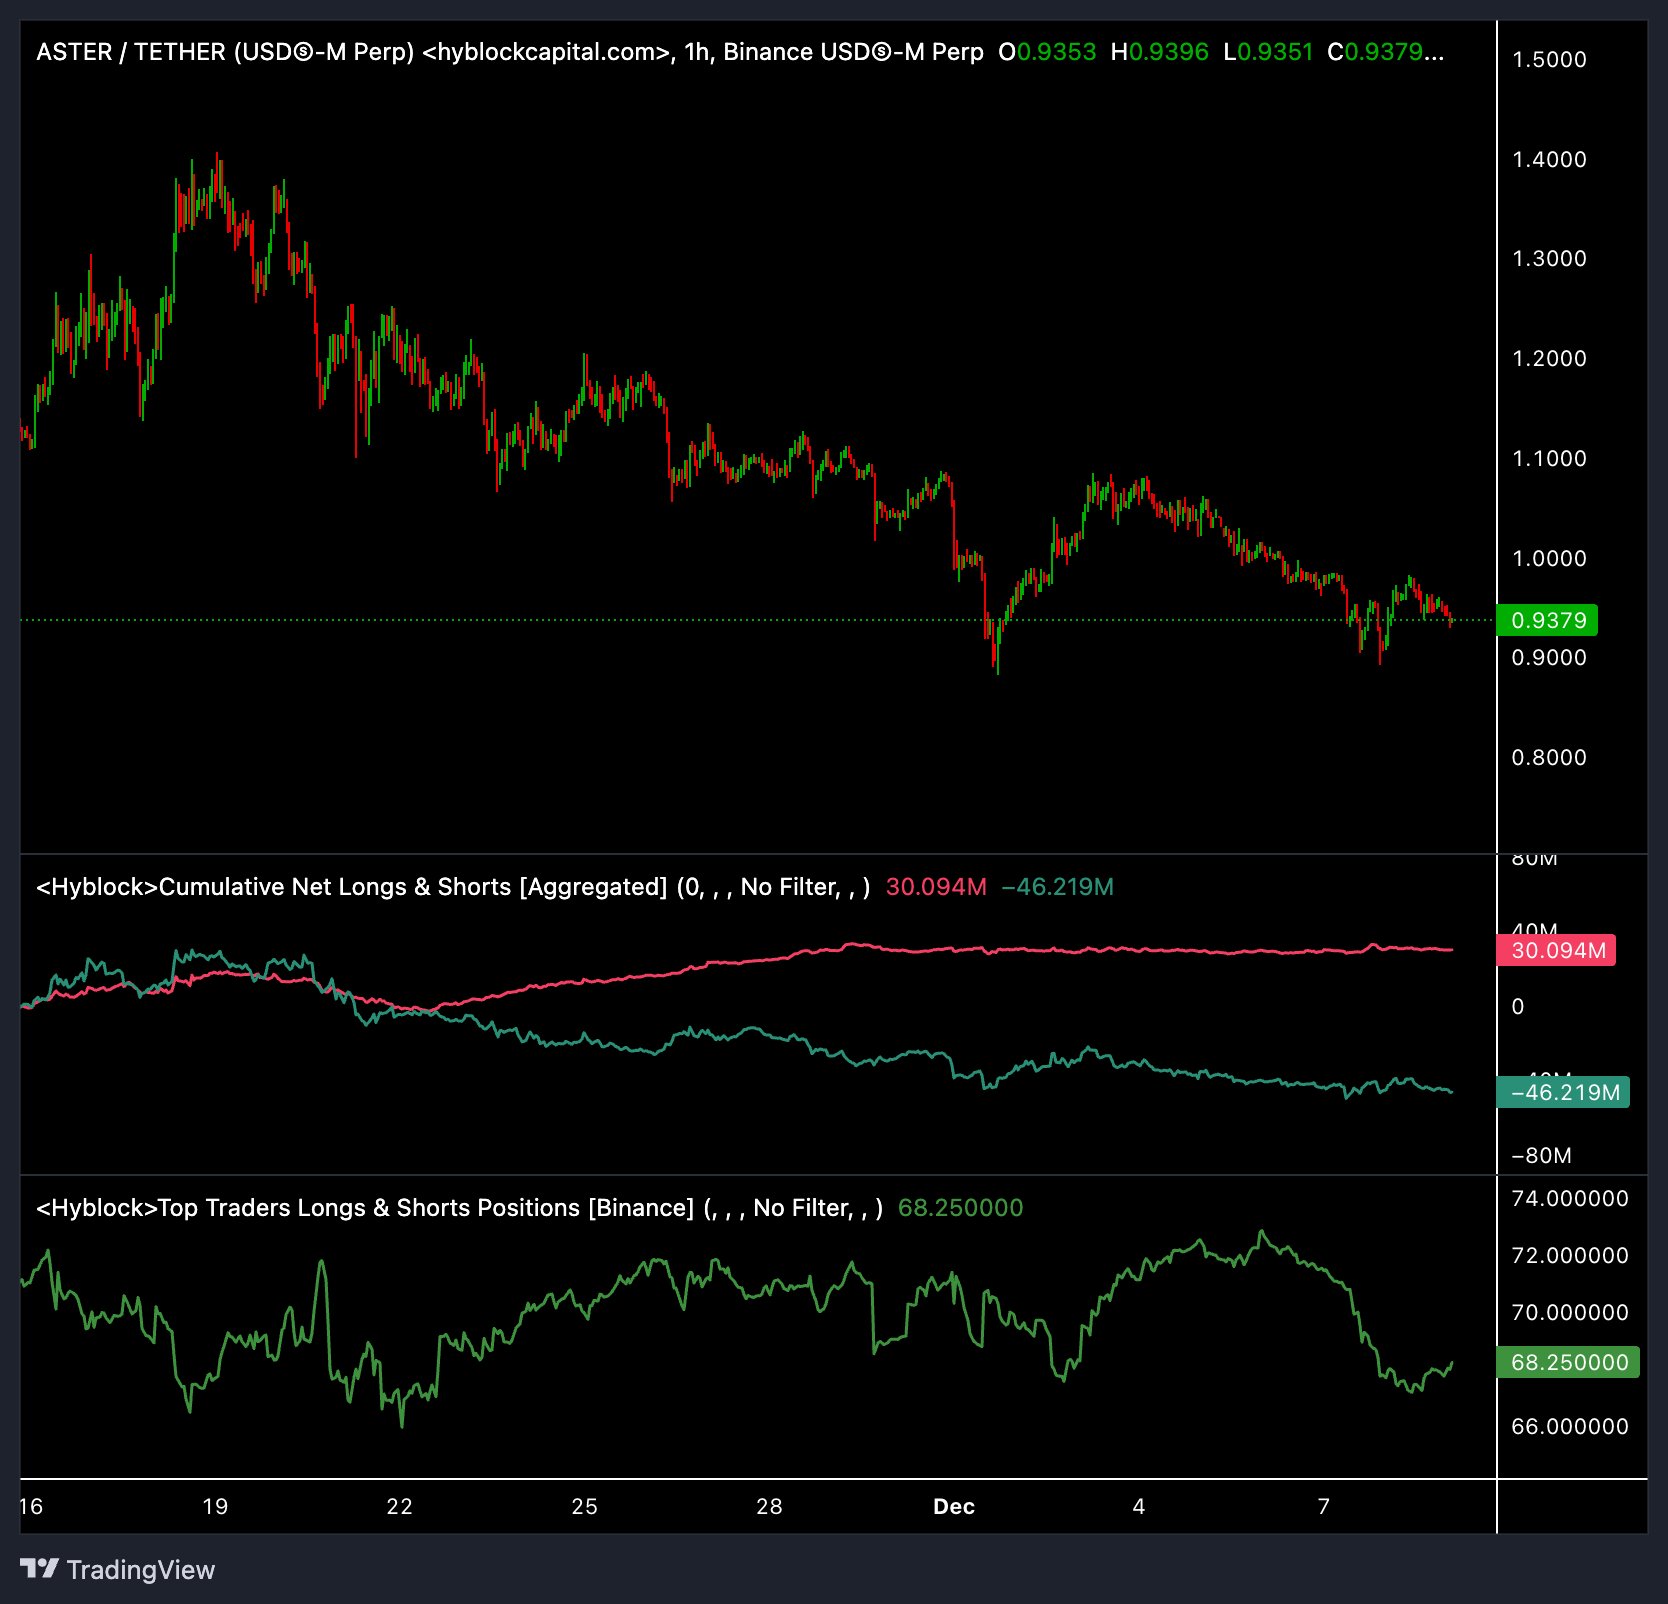
In contrast, larger whale accounts ($100,000–$10 million) added over $100 million in the same period, suggesting a divergence in behavior.
Simply put, smaller participants appeared to sell into the rally while higher-capital accounts increased their exposure.
Related: What’s behind the surge in privacy tokens as the rest of the market weakens?
That raises ZEC’s potential to continue its rebound toward the $500 level, given that the larger investors are looking forward to higher prices.
Bear flag may spoil party for ZEC bulls
Zcash’s latest rebound unfolded inside what still appeared to be a classic bear flag pattern, a weakening relief channel that formed after a steep November sell-off.
Historically, these rising channels resolved to the downside, and ZEC’s failure to hold above the flag’s upper trendline suggested that sellers were already regaining control as of Tuesday.
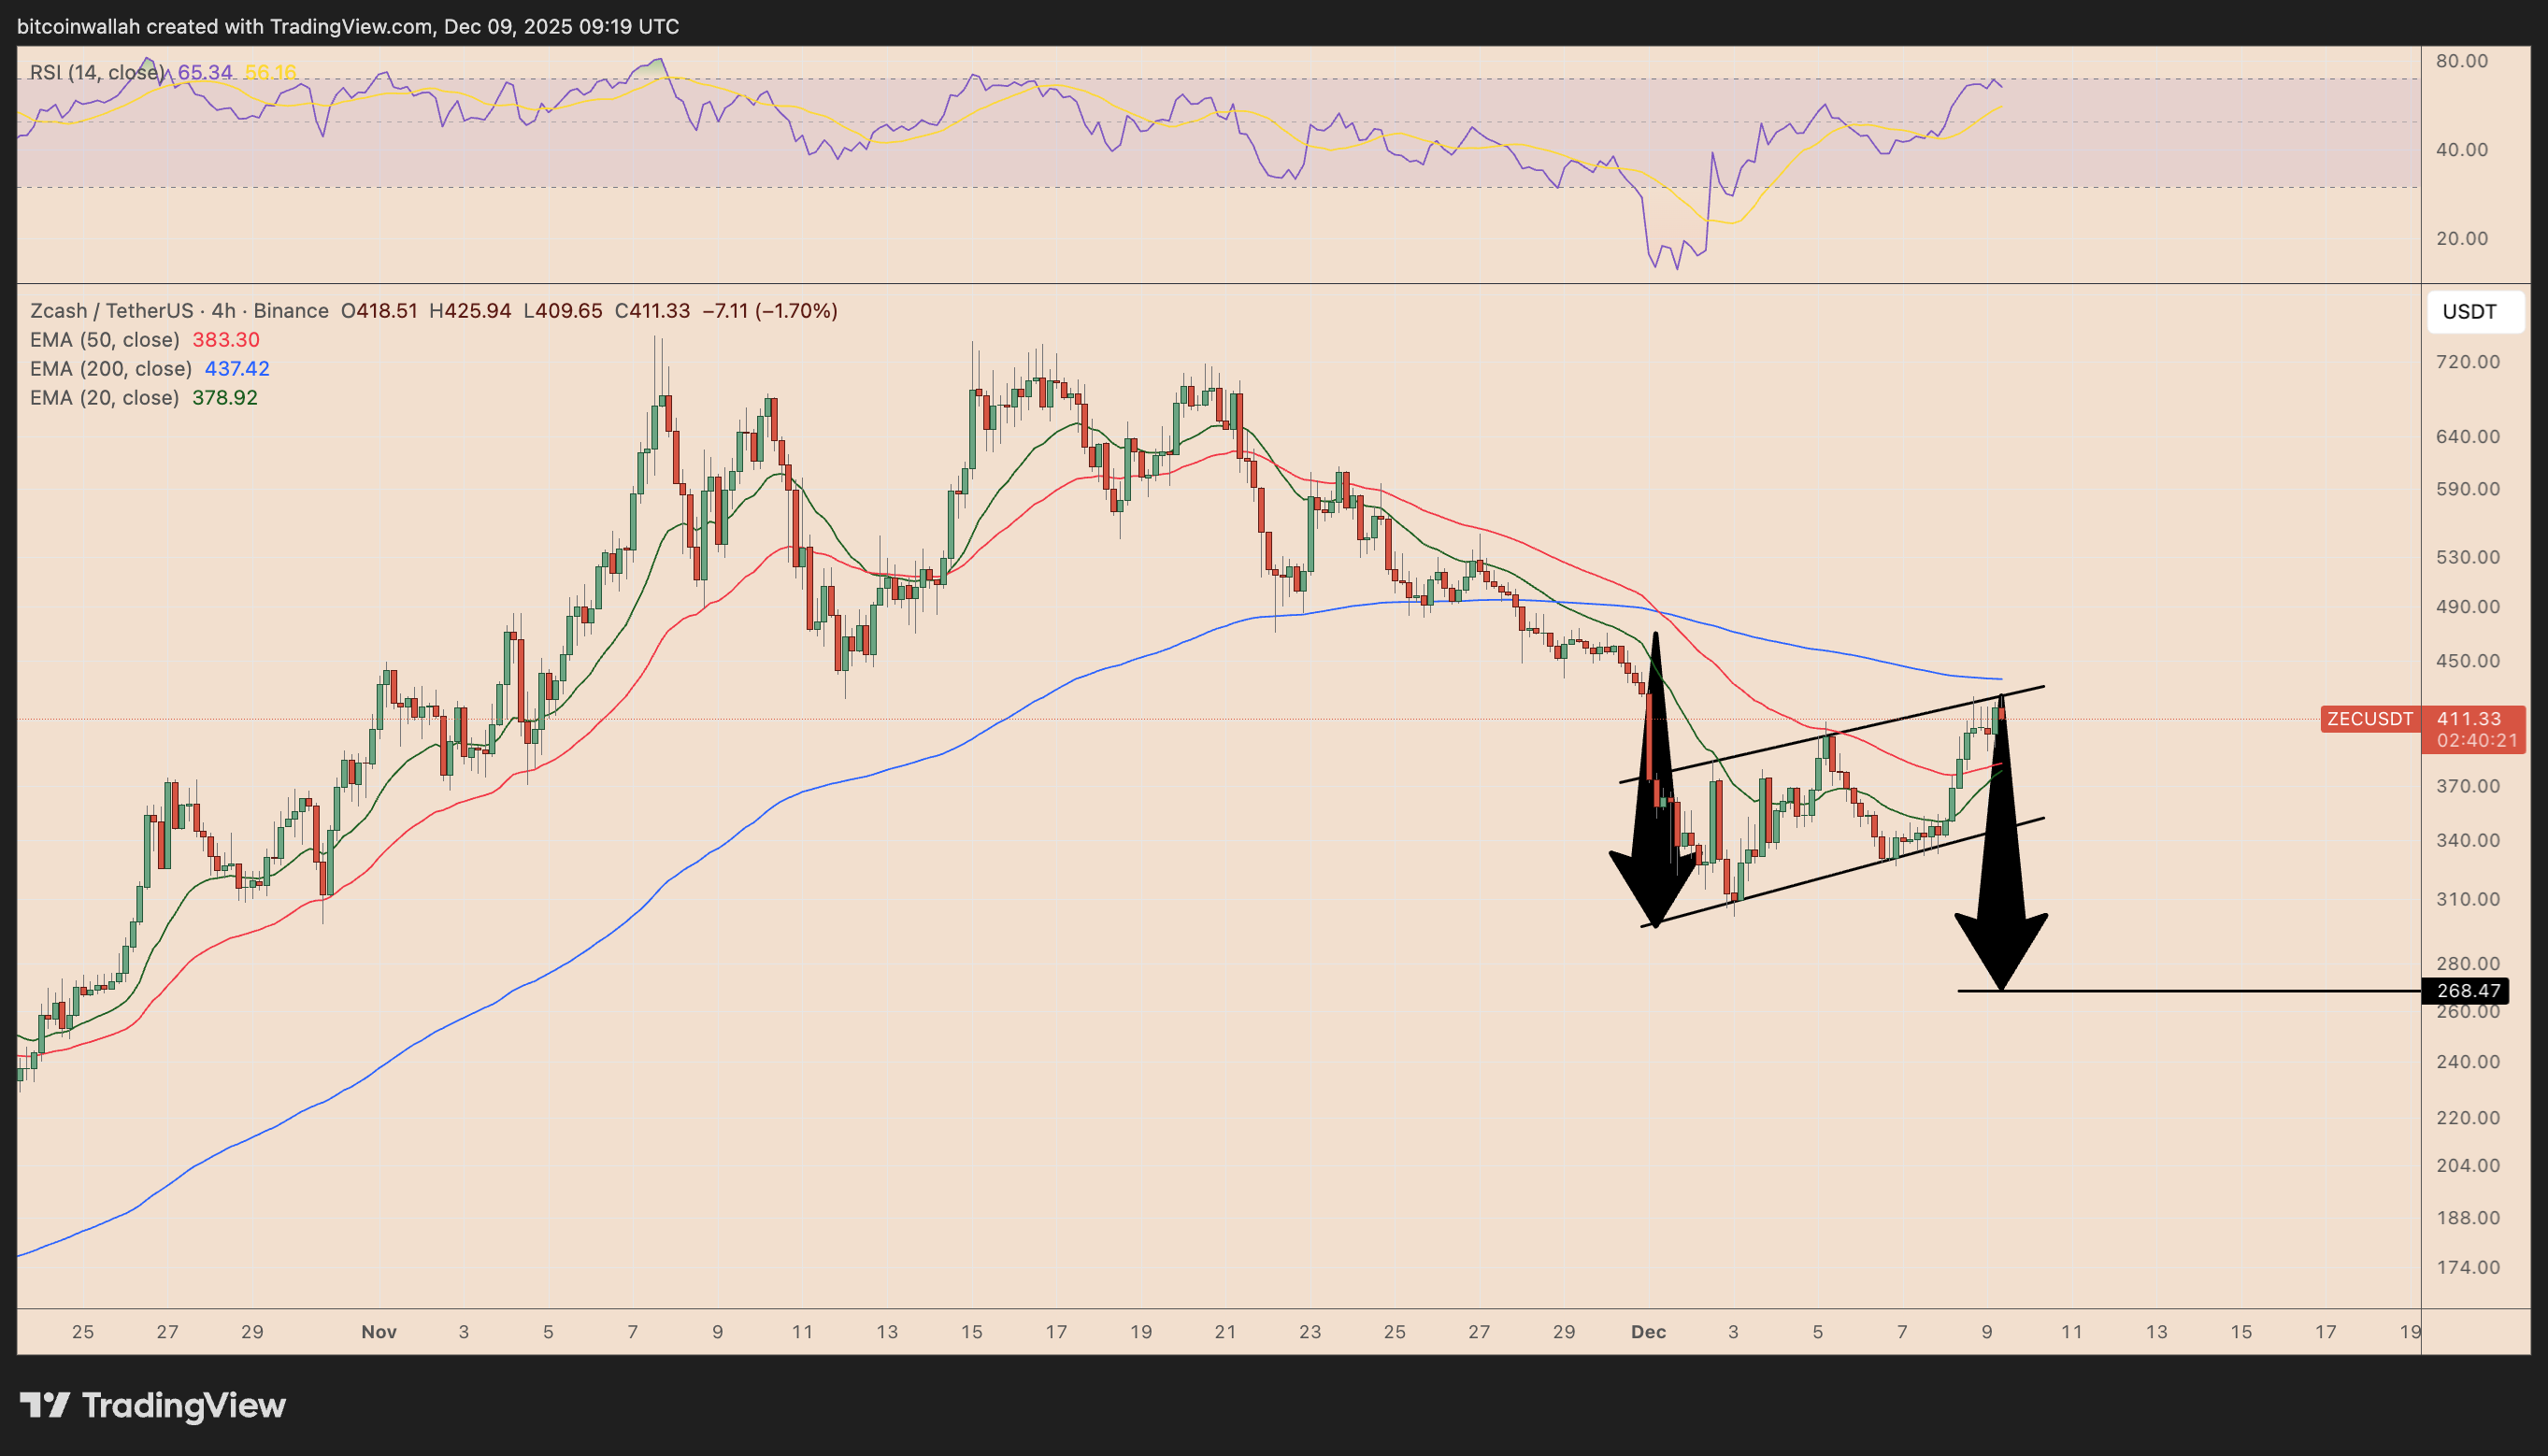
Price also struggled to break above the 200-day exponential moving average (200-4H EMA; the blue wave), reinforcing the bearish continuation setup.
At the same time, ZEC’s relative strength index (RSI) had pushed above the overbought threshold of 70, a region where upside momentum often fades.
Together, these signals suggested that a breakdown from the flag could have opened the door to a move toward the $260–$280 zone, which is approximately 35% below current price levels.
This article does not contain investment advice or recommendations. Every investment and trading move involves risk, and readers should conduct their own research when making a decision.